Loading document...
| Sound Level | dB (A) |
|---|---|
| Threshold of hearing | 0 |
| Whisper | 30 |
| Talking | 60 |
| City Traffic | 90 |
| Rock Concert | 120 |
| Jet Engine (10m away) | 150 |
The dB (A) scale is the most common measure used to quantify noise. It covers sound intensity over the entire audible scale and takes account of the sensitivity of the human ear to give an overall measure of "loudness".
In assessing the noise from a proposed wind turbine installation we are often interested in what noise levels will be at various distances from the wind turbine. It is accepted practice to calculate noise contributions from the wind turbine. This is because it is only practical to measure the wind turbine contribution accurately when it is 10 dBA above background noise. For example, background noise in a "quiet" environment is typically 30-40 dBA making it impossible to measure contributions less than 40-50 dB(A).
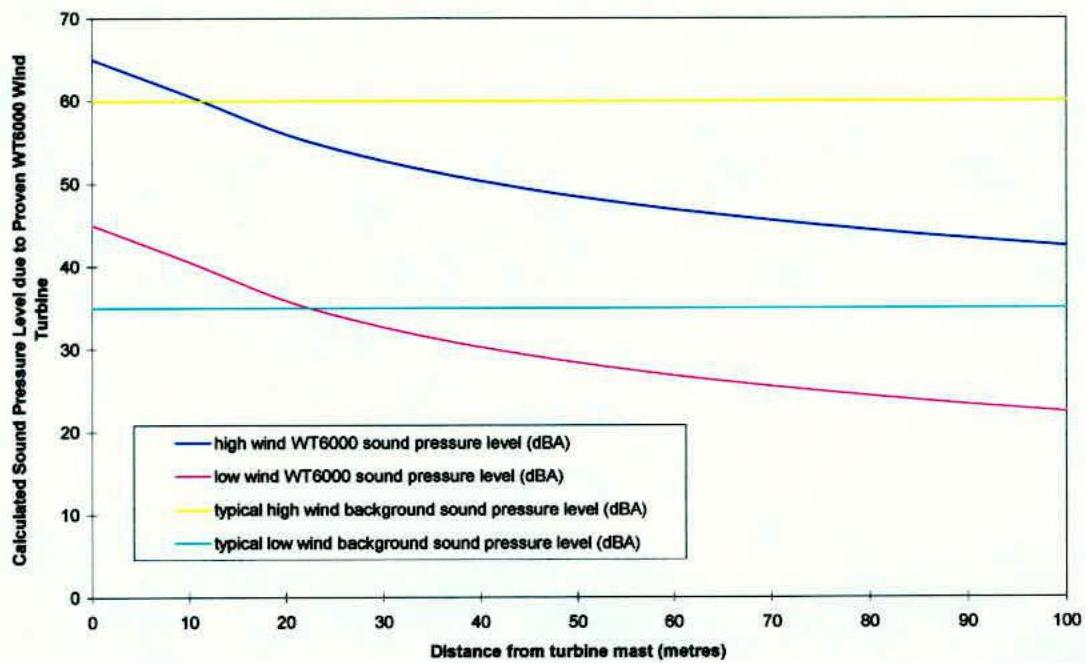
Figure 1 shows how the noise emitted by a Proven WT6000 wind turbine on a 9m mast will disperse over the local environment. Maximum noise output at the base of the machine was recorded at 65dB(A) at a wind speed of 20 m/s. The noise output at the base of the mast in light winds 5m/s was 45 dB(A). The sound meter was held at a height of 1.5m from the ground. Background noise is louder than the turbine when more than 25m from the mast in both cases.
Figure 2 shows how the combined noise of wind turbine plus background; this is what will be detected by the human ear.
Figure 3 graphs the dBA difference between wind turbine and background plus common complaint classifications. It can be generally taken that there will be no noise complaints where the turbine specific noise is 10dBA less than background. This happens at a distance of 40-75m depending on wind speed.
Details of the calculations used in these graphs are given in Appendices B & C.
WT6000 & Background Individual Sound Pressure Levels Figure 1
WT6000 plus Background Combined dB(A) Sound Pressure Levels Figure 2
WT6000 Noise Output Relative to Background (dBA) Figure 3
All measurements were taken on a portable SL-25 dBA sound meter at our demonstration wind turbine site in Kilmarnock. Proven Wind Turbines emit a swishing noise only - we do not believe full tonal analysis is needed for our small wind turbines (see also Appendix A).
The above method does not take account of wind "streaming" noise to the downwind side of the turbine. In practice, turbine dBA levels will be shifted downwind by a variable amount depending on the individual site.
In both cases the dB(A) readings taken as coming from the wind turbine certainly also included a contribution from background noise in a nearby tree. Secondly, in the graphs shown, the typical background dBA readings have been chosen very conservatively (low).
For both of the above reasons, the results shown can be taken to be a "worst case scenario". A 1996 market survey of present Proven customers indicated that all would be happy to have the turbine closer to their houses than at present and that none had had complaints from neighbours about turbine noise after installation.
Proven Wind Turbines Proven Engineering Products Moorfield Industrial Estate Kilmarnock KA2 0BA Tel +44 1563 543 020 Fax +44 1563 539 119 email [email protected]
| Feature | Benefit |
|---|---|
| Proven rotors are specially designed to operate at low rpm (typical max Tip Speed Ratio 6) | Blades and bearings rotate slowly keeping air noise to a minimum. |
| Direct Drive Permanent Magnet Generator | There is no gearbox as the rotor is coupled direct to the generator. This eliminates the gearbox hum which is the main source of noise in turbines with gearboxes. There are no touching parts. |
| Specially shaped blade tips | The rounded tips on Proven Wind Turbine blades are designed to reduce the vortices present at the end of any aerofoil. This keeps wind noise to a minimum. |
| height to hub | 9 | dBA high | 65 | |||||||||
| height meter | 1.5 | dBA low | 45 | |||||||||
| initial height | 7.5 | |||||||||||
| initial dist | 0 | |||||||||||
| db=10log(power in w/m2)+120 | ||||||||||||
| sound power=10^4(0.1(db-120) | ||||||||||||
| horizontal distance (m) | actual distance | sound high (w/m2) | sound low (W/m2) | high wind WT2500 sound pressure level (dBA) | low wind WT2500 sound pressure level (dBA) | typical high wind background sound pressure level (dBA) | typical low wind background sound pressure level (dBA) | combined WT6000 plus background sound high | combined WT6000 plus background sound low | high wind combined WT6000 and background sound pressure level (dBA) | low wind combined WT6000 and background sound pressure level (dBA) | |
| 0 | 7.5 | 3.16E-06 | 3.16E-08 | 65 | 45 | 60 | 35 | 4.16E-06 | 3.48E-08 | 66 | 45 | |
| 10 | 12.5 | 1.14E-06 | 1.14E-08 | 61 | 41 | 60 | 35 | 2.14E-06 | 1.45E-08 | 63 | 42 | |
| 20 | 21.4 | 3.9E-07 | 3.9E-09 | 56 | 36 | 60 | 35 | 1.39E-06 | 7.06E-09 | 61 | 38 | |
| 30 | 30.9 | 1.86E-07 | 1.86E-09 | 53 | 33 | 60 | 35 | 1.19E-06 | 5.02E-09 | 61 | 37 | |
| 40 | 40.7 | 1.07E-07 | 1.07E-09 | 50 | 30 | 60 | 35 | 1.11E-06 | 4.24E-09 | 60 | 36 | |
| 50 | 50.6 | 6.96E-08 | 6.96E-10 | 48 | 28 | 60 | 35 | 1.07E-06 | 3.86E-09 | 60 | 36 | |
| 60 | 60.5 | 4.87E-08 | 4.87E-10 | 47 | 27 | 60 | 35 | 1.05E-06 | 3.65E-09 | 60 | 36 | |
| 70 | 70.4 | 3.59E-08 | 3.59E-10 | 46 | 26 | 60 | 35 | 1.04E-06 | 3.52E-09 | 60 | 35 | |
| 80 | 80.4 | 2.76E-08 | 2.76E-10 | 44 | 24 | 60 | 35 | 1.03E-06 | 3.44E-09 | 60 | 35 | |
| 90 | 90.3 | 2.18E-08 | 2.18E-10 | 43 | 23 | 60 | 35 | 1.02E-06 | 3.38E-09 | 60 | 35 | |
| 100 | 100.3 | 1.77E-08 | 1.77E-10 | 42 | 22 | 60 | 35 | 1.02E-06 | 3.34E-09 | 60 | 35 | |
| sound w/m sound w/m2 | ||||||||||||
| 0.000001 | 3.16E-09 |
Given a sound power P_1 at distance d_1 from a noise source the sound power P_2 at distance d_2 may be calculated by the formula
3.
First convert the dBA ratings at their initial distances to sound powers using equation 2. Use the equation 3 to work out the sound powers at point X where you are interested in the total sound pressure level Add all the sound powers together to find Convert back using equation 1 to find
Addendum to Proven Noise Report (Appendix B) (Low wind)
Note: Since the decibel is a small unit and changes of less than 1 dB are not detectable to the human ear, it is common practice to show only integer values. In this spreadsheet the values are held at full precision and the calculations are carried out exactly, but are rounded to the nearest integer value for printing. Column 8 is the difference between column 7 and column 4 and on some lines there may seem to be an error if integer arithmetic is performed.
| Horiz. distance (m) | Actual distance (m) | Wind power (W/m2) | Sound press. level (dB(A)) | Background level (dB(A)) | Combined power (W/m2) | Combined level (dB(A)) | Difference (dB(A)) |
|---|---|---|---|---|---|---|---|
| 0 | 7.5 | 3.16E-08 | 45 | 35 | 3.48E-08 | 45 | |
| 60 | 60.5 | 4.87E-10 | 27 | 35 | 3.65E-09 | 36 | 9 |
| 65 | 65.4 | 4.15E-10 | 26 | 35 | 3.58E-09 | 36 | 9 |
| 70 | 70.4 | 3.59E-10 | 26 | 35 | 3.52E-09 | 35 | 10 |
| 75 | 75.4 | 3.13E-10 | 25 | 35 | 3.48E-09 | 35 | 10 |
| 80 | 80.4 | 2.76E-10 | 24 | 35 | 3.44E-09 | 35 | 11 |
Copyright in submitted documents remains with their authors. Request removal
View as Markdown